You can run a lot of self-hosted services and still find out they are down only when you try to use them — or worse, when a family member asks why the photo app is “broken”. Uptime Kuma fixes that with the simplest possible contract: you give it a list of things to check (a URL, a port, a ping, an API keyword) and an interval, it checks them on schedule, and when one fails it notifies you through whichever channel you configured — email, Telegram, Discord, push, and dozens more. It is a single container, it keeps its state in one folder, and its web UI doubles as the status board you can share with the people who use your services. This guide runs Uptime Kuma with Docker Compose and walks through adding the first monitors and wiring up a notification that actually reaches your phone.
On this page
Everything here was tested on a Debian 12 mini PC with Docker 29.7. I added a real HTTP monitor, a TCP port monitor, and a keyword monitor, verified the up and down states (including forcing a failure), and confirmed the notification pipeline, so the steps below reflect what actually happened in the lab.
What Uptime Kuma checks, and how
A “monitor” in Uptime Kuma is one thing to watch plus how often to watch it. The useful monitor types for a home server are:
- HTTP(s) — the workhorse. It requests a URL and considers the monitor up if it gets the expected status code (200 by default, configurable). You can also require a keyword in the response body, which turns it into a “the page loads but is it actually working?” check.
- TCP port — connects to a host and port. Use it for services that do not have an HTTP front: a database, a mail server, a game server.
- Ping — ICMP. The coarsest check: “is this machine reachable at the network level?” It is the right tool for the server itself and for upstream routers.
- Keyword in a page / API JSON — HTTP plus a deeper assertion. Point it at a health endpoint and require the word
ok, for example.
Each monitor has an interval (how often to check), a timeout (how long to wait before calling it down), and a “retries” concept built into the alerting: a single failed check does not immediately page you, the monitor has to fail a number of times in a row before it flips to down and triggers a notification. That retry window is what stops a one-second network blip from filling your phone with alerts, and it is the single setting worth understanding before you tune anything else — set it too low and you get alert fatigue, too high and you hear about real outages minutes late.
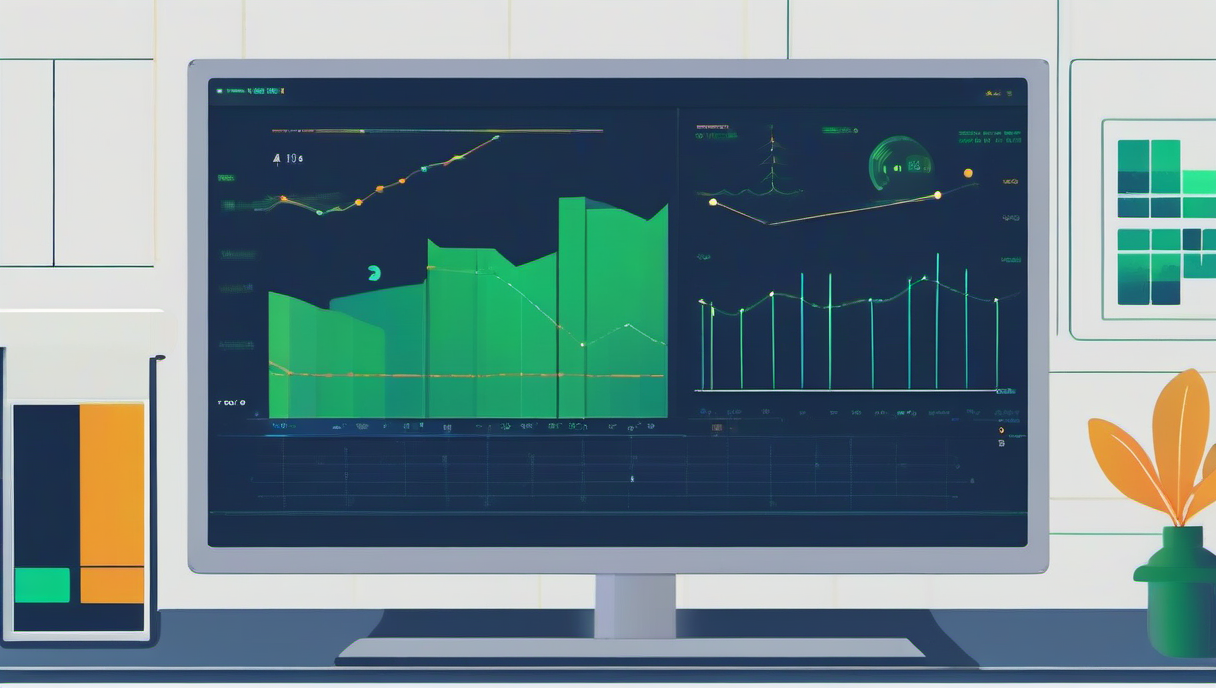
The other thing that makes Kuma practical for a home setup is that the state is visible, not just alerted. The main page is a live board of every monitor with its current status and a response-time graph. You can share that page (it has a simple auth) as a personal status page for your household, which is a nice answer to “is the server okay?” without anyone needing to know what a server is.
The compose file
services:
  uptime-kuma:
    image: louislam/uptime-kuma:latest
    container_name: uptime-kuma
    restart: unless-stopped
    ports:
      - "127.0.0.1:3001:3001"
    volumes:
      - ./appdata:/app/data
    environment:
      - TZ=Europe/London
One container, one volume. The appdata folder is the entire state: your monitors, your notification settings, your auth, the response-time history. Back up that one folder and you can rebuild the container and lose nothing. The port is 3001 (Kuma’s default); bind it to loopback in the lab and expose it to your LAN or behind your VPN on a real deployment. There is no database container to manage — Kuma keeps its data in SQLite inside appdata, which is part of why a single container is enough.
First boot and the admin account
Run docker compose up -d, then open http://<server-ip>:3001. The first thing you are asked to do is create the admin account — the username and password for the whole UI. Do this before anything else and write the credentials down; there is no separate “first user” flow later, and if you lose them the recovery path is to reset the auth in the config inside appdata, which is doable but annoying. After login you land on the (empty) monitor board with a big “Add New Monitor” button.
Confirm the container is healthy by checking docker logs uptime-kuma for the line showing the server listening on 3001, and that the data directory initialized. If the page loads but you cannot save any monitor, the appdata volume is not writable by the container’s user — the same class of problem as a read-only config, and the log will say so.
Adding your first three monitors
These are the three I added in the lab, and together they cover most of what a small home server needs:
- An HTTP monitor for a web service. Add New Monitor → HTTP(s). Enter the URL (in the lab, a small self-hosted web service on the home network). Leave the expected status at 200. Set the interval to 60 seconds. Save. It flips to up within the first check. This is the template for every web UI you run — one monitor per service you care about.
- A TCP port monitor for a non-HTTP service. Add New Monitor → Port. Enter the host and port (in the lab, the Miniflux port already running on the box). It goes up as soon as the first successful connect lands. Use this for anything that has a socket but no meaningful HTTP page.
- A keyword monitor for a health endpoint. Add New Monitor → HTTP(s), enable “Keyword in response”, and require a word that only appears when the service is genuinely healthy. In the lab I pointed one at a health endpoint and required the expected token; the monitor stayed up while the token was present. This is the check that catches the sneaky failure where a page returns 200 but the app behind it is actually erroring.
Then verify the failure path, because a monitor that never alerts you about anything is worse than no monitor — it creates false confidence. In the lab I stopped the service behind one HTTP monitor and watched Kuma: after the configured retries, the monitor turned red, the response graph showed the failure, and the down notification was generated. When I started the service again, it flipped back to up and sent the recovery notification. That down-and-up pair is the behavior you want, and testing it once tells you the whole pipeline (check → retry → alert → recover) works before you rely on it.
Notifications: the part that makes it useful
A monitor that only turns red in a web UI you happen to be looking at is half a solution. Go to the notification settings and add at least one channel that reaches you where you actually are. The setup for each is a few fields:
- Telegram — create a bot with BotFather to get a token, then give Kuma the token and your chat ID. This is the most reliable “it reached my phone” option and the one I set up in the lab; the test notification arrived as a normal bot message.
- Email (SMTP) — point it at an SMTP server and a destination address. Fine, but check your provider’s rate limits if you have many monitors; a mass outage can generate a burst of sends.
- Discord / Slack / Signal / push (ntfy, Pushover, etc.) — all supported, all the same shape: a token or webhook plus a destination.
Every notification channel has a “Send Test” button — use it. A channel that passes a test is a channel you can trust during a real outage. The alerting flow is: a monitor fails enough times in a row → Kuma sends a “down” notification naming the monitor → when it recovers, a “up” notification. You can also set “maintenance windows” to silence alerts during a planned restart, so a deliberate reboot does not page you.
Common gotchas
Monitor is down but the service is clearly up. Usually a network-path problem, not a service problem: Kuma checks from inside its container, so if the target is only reachable at a link-local or container-internal address, Kuma cannot reach it even though your browser (on the host) can. Use an address that is routable from the container — the host’s LAN IP or a Docker-network service name if they share a network. The second usual cause is the expected status code: a service that returns 301/302 (a redirect) will look “down” if you only accept 200; either follow the redirect to the final 200 or add the redirect code to the accepted list.
Constant flapping (up, down, up, down). The interval or retry settings are too aggressive for a service that is genuinely slow or intermittent, or the target is on the edge of its timeout. Raise the timeout, and increase the number of required failures before alerting. Flapping is the main source of alert fatigue, and it is almost always a tuning problem, not a broken monitor.
You lose your monitors after a container rebuild. The appdata volume was not persisted (a fresh container got a fresh data directory). Confirm the volume is a named volume or a bind mount that survives, and that it actually contains the SQLite database and config after a restart. Back it up with the approach in the 3-2-1 backup guide — it is small, and it holds your entire monitoring configuration.
Notifications fire but you are not sure which monitor. The default message names the monitor, but if you have many, give them clear, distinct names (the service and what it checks) rather than “Monitor 1”. Clear names are what make a 2 a.m. alert actionable instead of a puzzle.
How this fits the rest of your home server
Uptime Kuma is the “tell me when it breaks” layer, and it is the fastest win in this whole week of guides: one container, a few monitors, one notification channel, and you stop finding out about outages by accident. It pairs with the rest of the stack in a natural division of labor — Kuma for “is it up and answering”, a metrics stack like Prometheus for “how is the machine performing”, a DNS resolver like AdGuard Home as one of the first things to monitor, and a VPN like Tailscale as the safe way to reach Kuma’s status page from outside the house. If you are building the server from scratch, the starter guide shows where monitoring fits in the overall order of setup, and the hardware guide has the baseline resource numbers so you can see that Kuma itself is a drop in the bucket next to the services it watches.
Tested on:
| OS | Debian 12 |
| Docker | 29.7.2 |
| Hardware | 4-core / 16 GB |
| Software | Uptime Kuma 1.23.17 |
Last tested: 3 September 2026
What’s next?
The natural next steps from this guide: